IoT Reptile Enclosure Using AWS
A Senior Project
presented to
The Faculty of the Computer Science Department
California Polytechnic State University, San Luis Obispo
In Partial Fulfillment
Of the Requirements for the Degree
Bachelor of Science
By
Charles Miller
July 2021
Copyright 2021 Charles Miller
3.5 Architecture Summary Table 13
A special thank you to Shayda Fatoorchi, whose knowledge of reptiles was instrumental in the completion of this project. And more broadly: for her love and compassion, which was at the heart of my success here at Cal Poly.
Providing care for a reptile can be arduous and overly complicated. Proper husbandry requires the average reptile enthusiast to be capable of installing a host of sensing equipment, and be proficient at deciphering their readings. As a consequence, would-be pet owners may be deterred from homing an animal, and new reptile owners may feel a lack of confidence in their ability to provide care for their pet. Even seasoned enthusiasts may feel anxiety from keeping reptiles, as these animals often require routine monitoring and specialized equipment. One such example is the necessity of heat lamps and heat pads. These pieces of equipment pose risks to the owner and animal alike, as simple malfunctions can start fires or lead to dangerous living conditions for the animal. Some solutions exist for mitigating this, such as power strips that are regulated by temperature probes, but few solutions exist for proactively informing an owner of any departures from typical operating conditions. This demonstrates a broader problem: existing equipment is technically lacking, and suffers from a lack of connectivity. Another common complaint voiced by hobbyists is the general lack of configurability found in reptile equipment. Different animals require different care, and their ideal living conditions can vary tremendously. Moreover, these parameters can change throughout the course of an animal’s life. For example, juvenile snakes may require a higher ambient temperature, and a direct source of heat that is lower in temperature. But as they grow older, the same snake may require additional humidity and a warmer source of direct heat. Unfortunately, most off the shelf temperature gauges will not be able to account for this distinction. More than likely, the owner would be expected to purchase two gauges, and swap them out as the snake grows older. To summarize, present solutions for enclosure monitoring are: difficult to interface with, technically lacking, or are not sufficiently configurable.
The goal of this project is to remedy or allay some of these concerns that accompany caring for reptiles, by creating a proof of concept for an approachable means of monitoring enclosures. Secondarily, this project aims to empower pet owners, by enabling them to tailor their experience to their animal’s needs. Lastly, this project hopes to engage pet owners by allowing them to gather unique insights about their pet and its enclosure. This project attempts to accomplish these goals through the development of a mobile application, the deployment of a robust cloud infrastructure hosted on Amazon’s Web Services, and the creation of an easy to install networked enclosure monitoring system. The mobile application is intended to serve as the central location for monitoring an enclosure, and will provide the user with: explanatory visual indicators for sensor readings, live camera footage, and insights about their pet’s enclosure over time. The hope is that a mobile application will provide a modern and familiar experience for the average individual, with the added benefit of giving them a peace of mind that accompanies being able to remotely check on their pet’s habitat. By leveraging Amazon’s Web Services, the system will also play a more proactive role in monitoring a pet’s habitat, and will be capable of alerting the owner if sensor readings deviate from a specified range. These alerts will take the form of either SMS messages and or push notifications. Meanwhile, the desire for the monitoring system is to deliver a discrete unit that is easy to install and relatively simple to configure.
Enclosure refers to the home of an animal. In the context of caring for reptiles, an enclosure typically takes the form of a terrarium and its size is measured in gallons. For the sake of this project, enclosure is meant to refer to a terrarium that has been augmented with the monitoring system. Similarly, the term owner and user are used interchangeably to refer to a theoretical user of this proof of concept monitoring system and its accompanying application.
Raspberry Pi is a brand of single-board computers capable of interfacing with sensors and cameras. Likewise, the Raspberry Pi is capable of hosting a real time operating system and performing networking tasks. In the context of this project, the Raspberry Pi is the physical piece of equipment that captures sensor data and resides inside the animal’s enclosure.
IoT - Or, “Internet of Things” is used to describe physical equipment known as “things”, that are connected through the internet. Typically, IoT devices have sensors of some sort and are often used in home automation. Some well known examples of IoT devices are Amazon’s Echo product line, and the various Google Home products.
Amazon Web Services (AWS), is a platform and suite of tools for developing and maintaining scalable applications. AWS is used throughout the world, and is responsible for hosting a non-trivial portion of the internet. Services like IoT Core and Amazon Kinesis Video streams are responsible for ingesting the data reported by the enclosure, while services like Lambda and API Gateway are responsible for performing work in a serverless environment. Serverless is a business phrase used to describe tools or services that handle the boilerplate tasks of a server, on behalf of the user. In the case of API Gateway, the service abstracts the common work carried out by a web server, like: handling requests, routing, and managing security. Additionally, API Gateway includes a user interface to further reduce the know-how required to implement and maintain an API. Lambda is an AWS service that enables users to write one-off functions that are executed in a cloud environment. These functions may be triggered by other AWS products, and are used throughout the project to perform domain specific tasks - like checking whether or not a sensor reading is within a valid range of values. DynamoDB - another offering by AWS, is a NoSQL database that is used to house data reported by the enclosure.
Flutter is Google’s cross platform mobile application framework, which is written in and with Dart - a programming language developed by Google. While the framework is still relatively new, it provides developers an approachable method of creating feature rich mobile applications for both iOS and Android devices.
MQTT - Or “Message Queuing Telemetry Transport”” is a protocol favored by IoT devices, because of its small resource footprint - an important issue for embedded devices that are more technically constrained. The protocol follows a publisher subscriber model, meaning that multiple listeners may subscribe to a “topic”, and will be notified of any messages that a publisher sends to said topic.
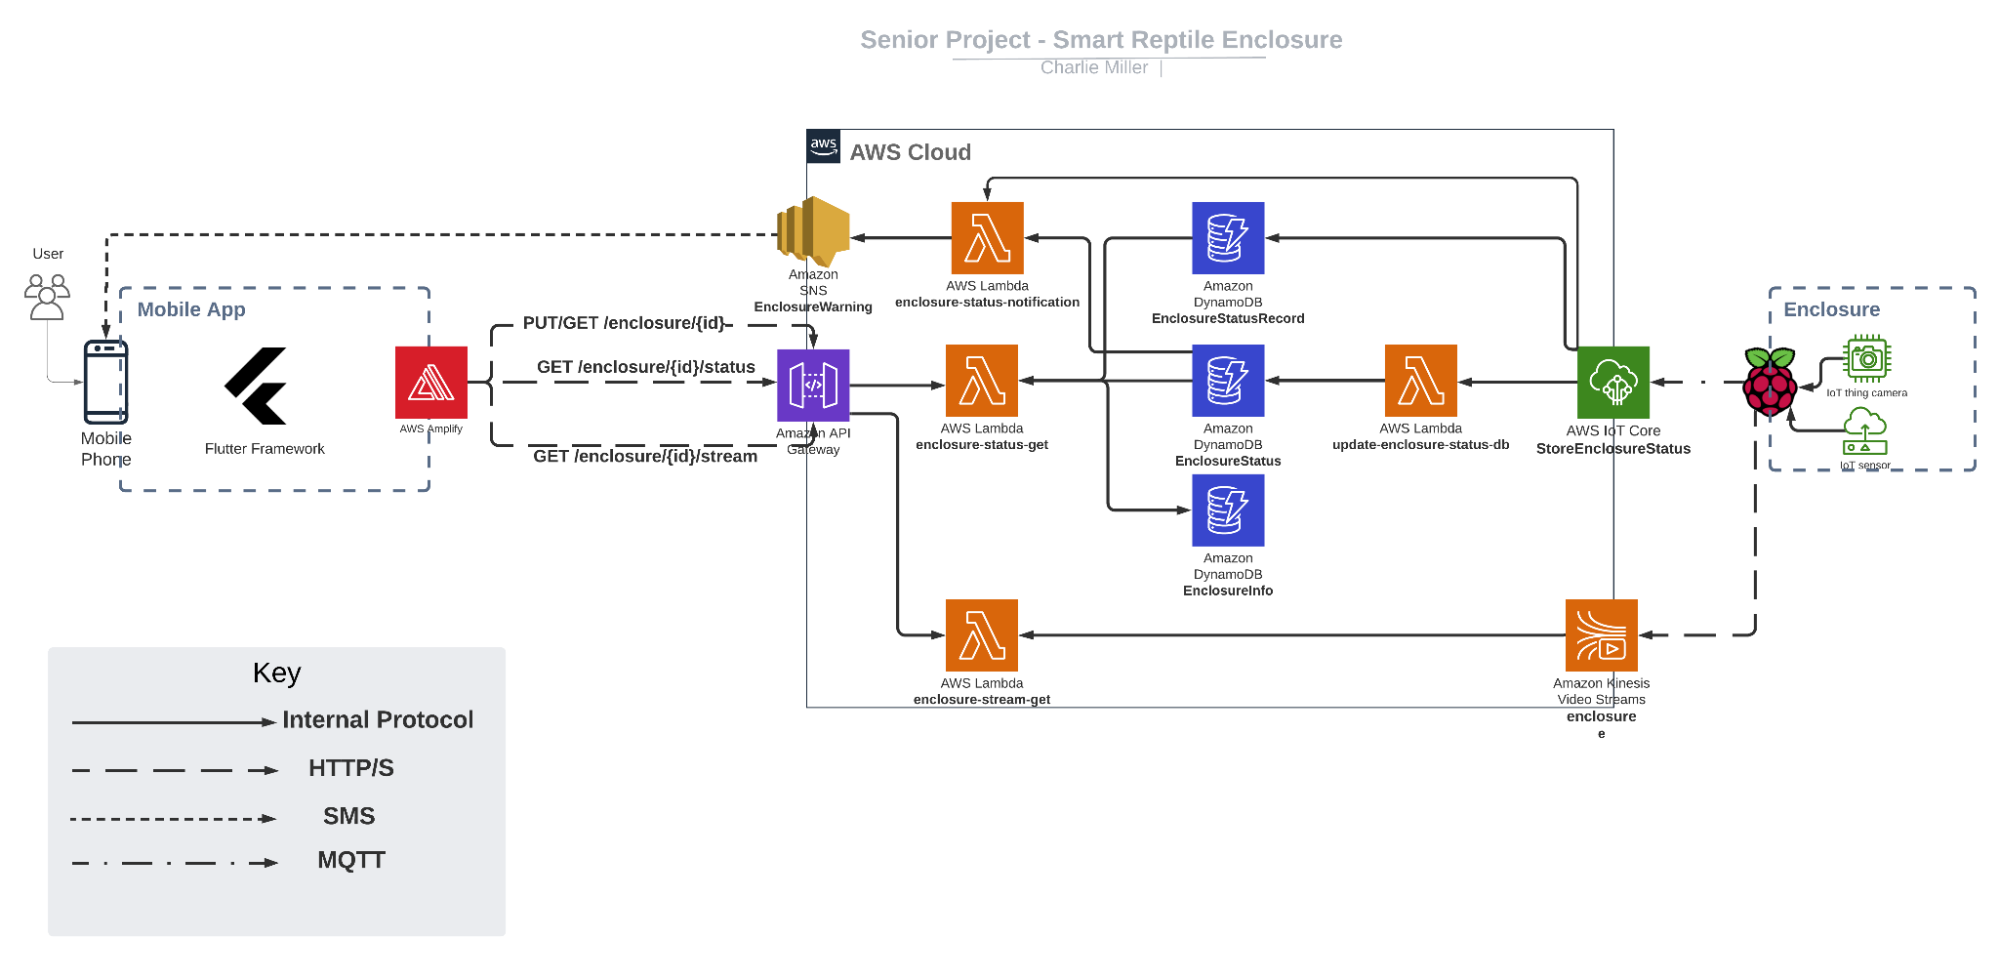
The project is distributed across three components: a front-end mobile application, the AWS cloud backend, and the monitoring system within the enclosure.
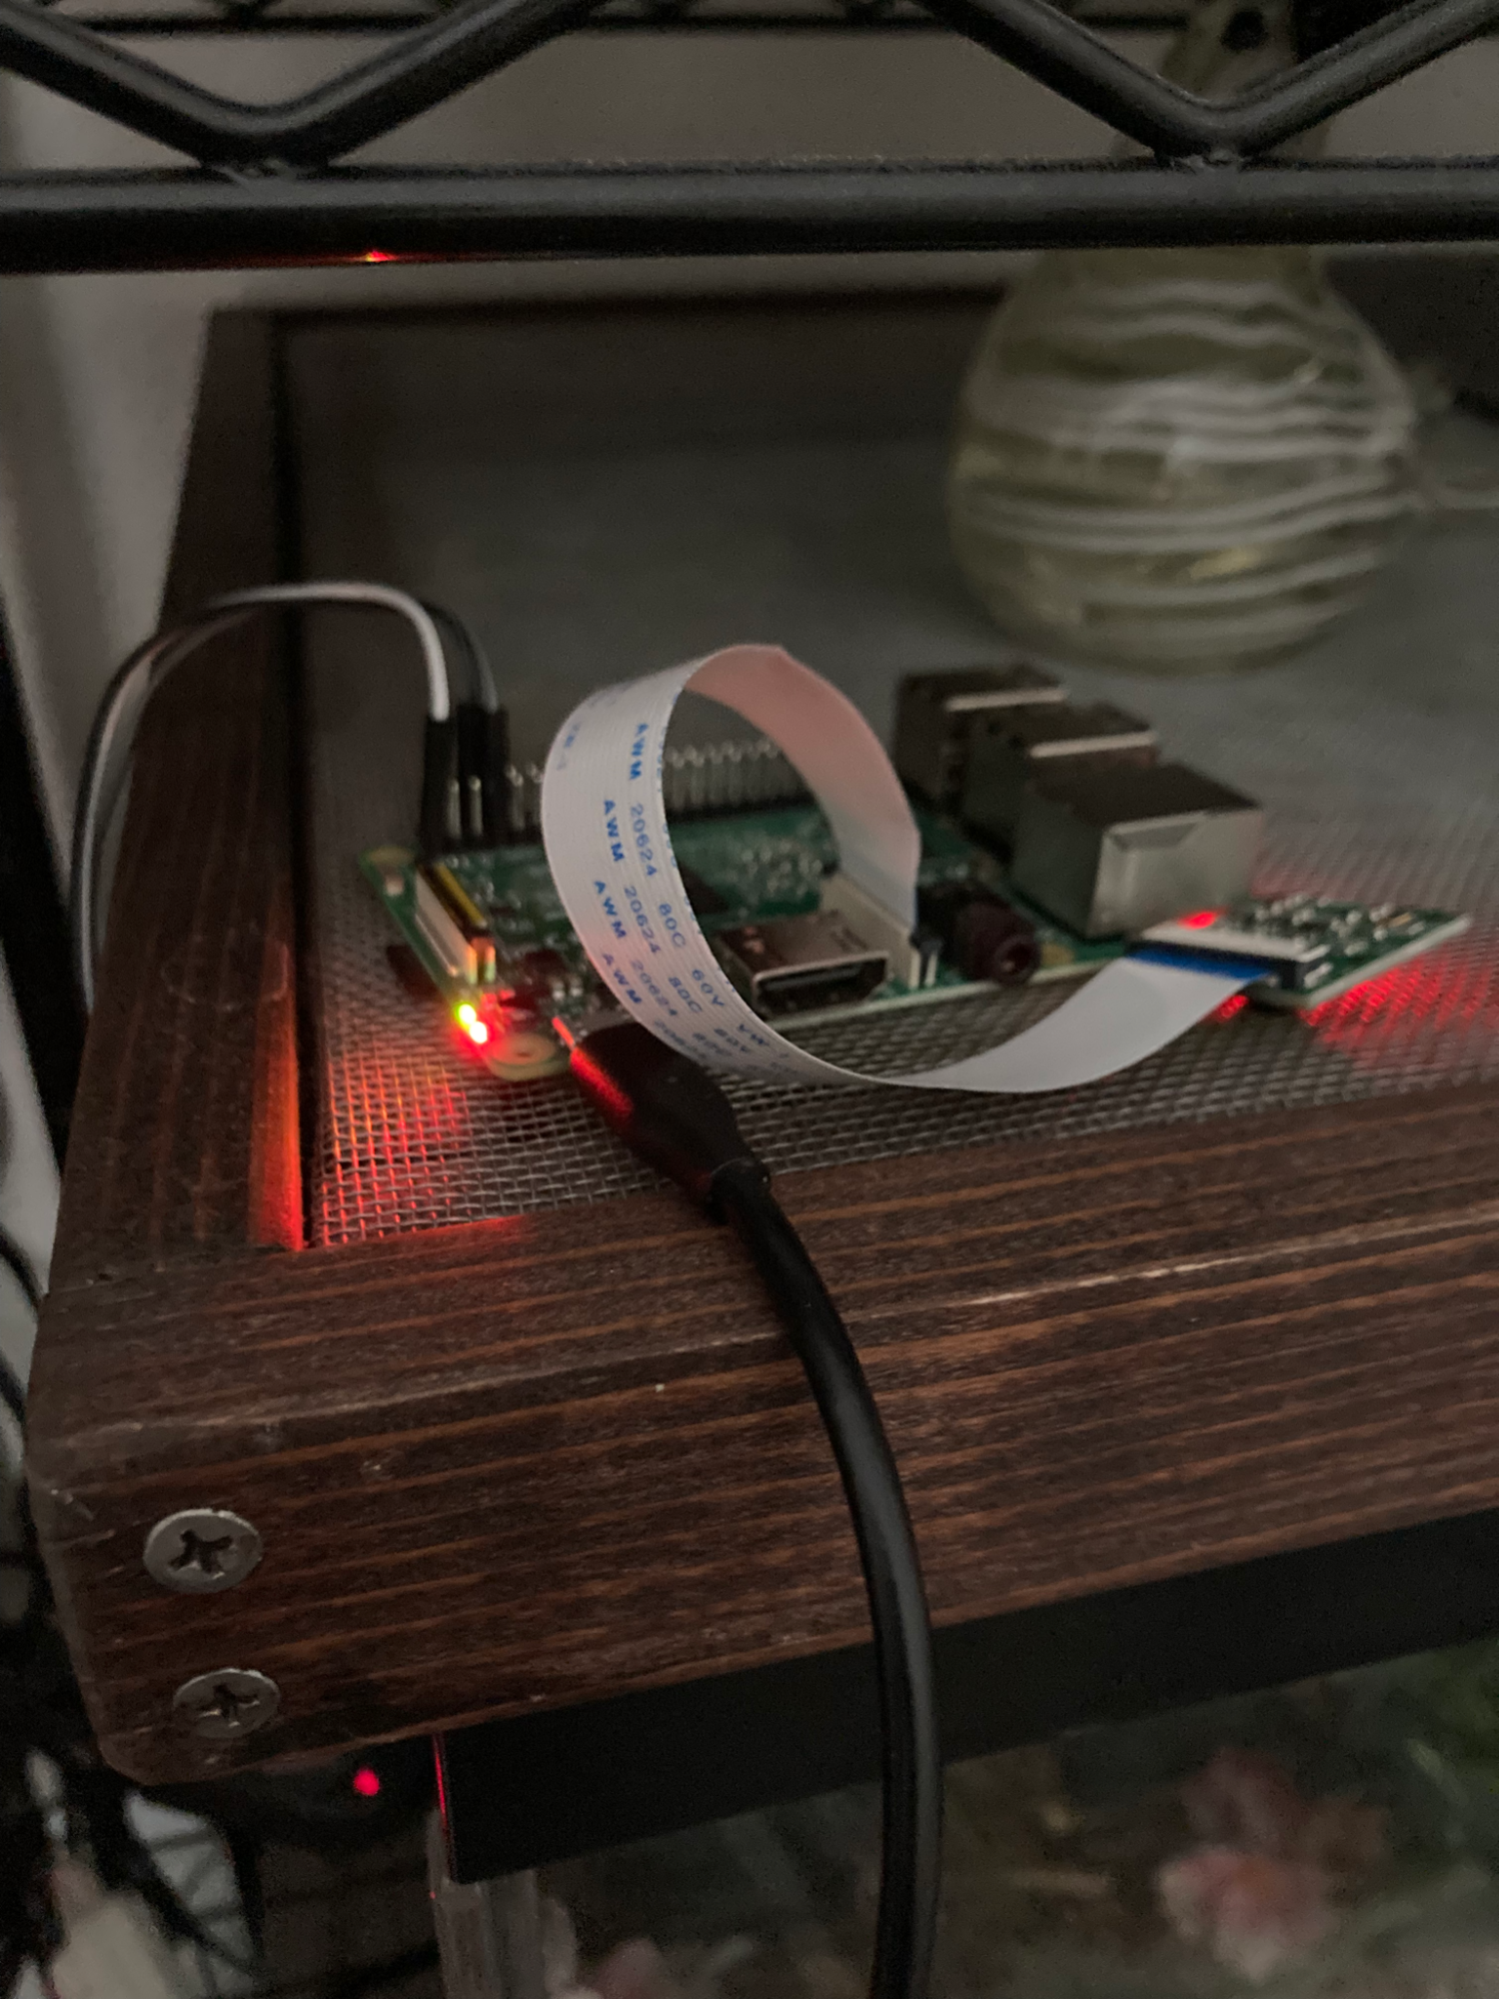
Much of the initial work for this portion of the project was spent researching sensing equipment and existing IoT technologies. The decision was made early on, to base the monitoring unit around a Raspberry Pi (specifically a 3rd generation unit). The primary reasons behind adopting this technology, as opposed to a more bare-bones microcontroller - like an Arduino, was to simplify the development process and take full advantage of a modern operating system. With the foundational piece of hardware determined, attention turned towards procuring compatible sensors and other pieces of hardware. After having consulted a number of reptile care guides, and a couple of reptile enthusiasts, it was decided that any minimal viable solution should at least include the ability to read the temperature and humidity of the enclosure. For this function, a DHT22 was ultimately selected, as there was an abundance of documentation for the particular unit and also had the benefit of being widely available. After having referred to pinouts of both the Pi[1] and the sensor [2], the sensor was appropriately wired and a simple Python script was written to retrieve both the temperature and humidity values from the sensor. In order to address other goals of the project, it was clear that a camera of some sort would need to be included in the monitoring system. Though there is a wider selection of USB cameras, concerns over driver compatibility and a desire to keep a small form factor led to the selection of a camera that would be compatible with the Raspberry Pi’s on-board camera interface. Due to the shortage of official first-party camera modules, a cheaper third-party module was purchased for this proof of concept.
With the physical equipment determined and ordered, focus shifted to selecting a platform suited for interfacing with the monitoring system. Exploration of existing IoT technologies immediately returned promising results, such as AWS and its IoT Core service, as well as Google’s own Cloud IoT service. After taking some time to vet each platform, AWS was selected to be the platform of choice moving forward. This decision was largely influenced by the breadth of documentation provided by AWS, and the overwhelming number of endorsements from other industry giants. Existing documentation from Amazon detailed how a Raspberry Pi could be used to communicate with the IoT Core service via MQTT. While the code from the sample [3] would require some minor tweaking, automation, and integrating with sensors, it would still prove to be instrumental in progressing with reporting sensor data. Similar investigations were done into AWS Kinesis Video Streams, and allowed for the uncovering of a useful sample project [4]. While some of the documentation for this project was slightly outdated, it was still generally accurate and was sufficient in streaming video data to the project’s Kinesis Video Stream. In order to securely interface with the AWS backend of the system, a host of policies and security roles needed to be configured ahead of time through AWS’s IAM service. Once properly configured, these security details were either saved as environment variables or as credential files on the Pi. Then, Bash scripts were written to invoke the monitoring processes with references to these security details. These precautions were taken to ensure that private information wasn’t captured by git and inadvertently published along with the project’s source code.
[1] https://datasheets.raspberrypi.org/cm/cm1-and-cm3-datasheet.pdf
[2] https://www.sparkfun.com/datasheets/Sensors/Temperature/DHT22.pdf
[3] https://docs.aws.amazon.com/iot/latest/developerguide/connecting-to-existing-device.html
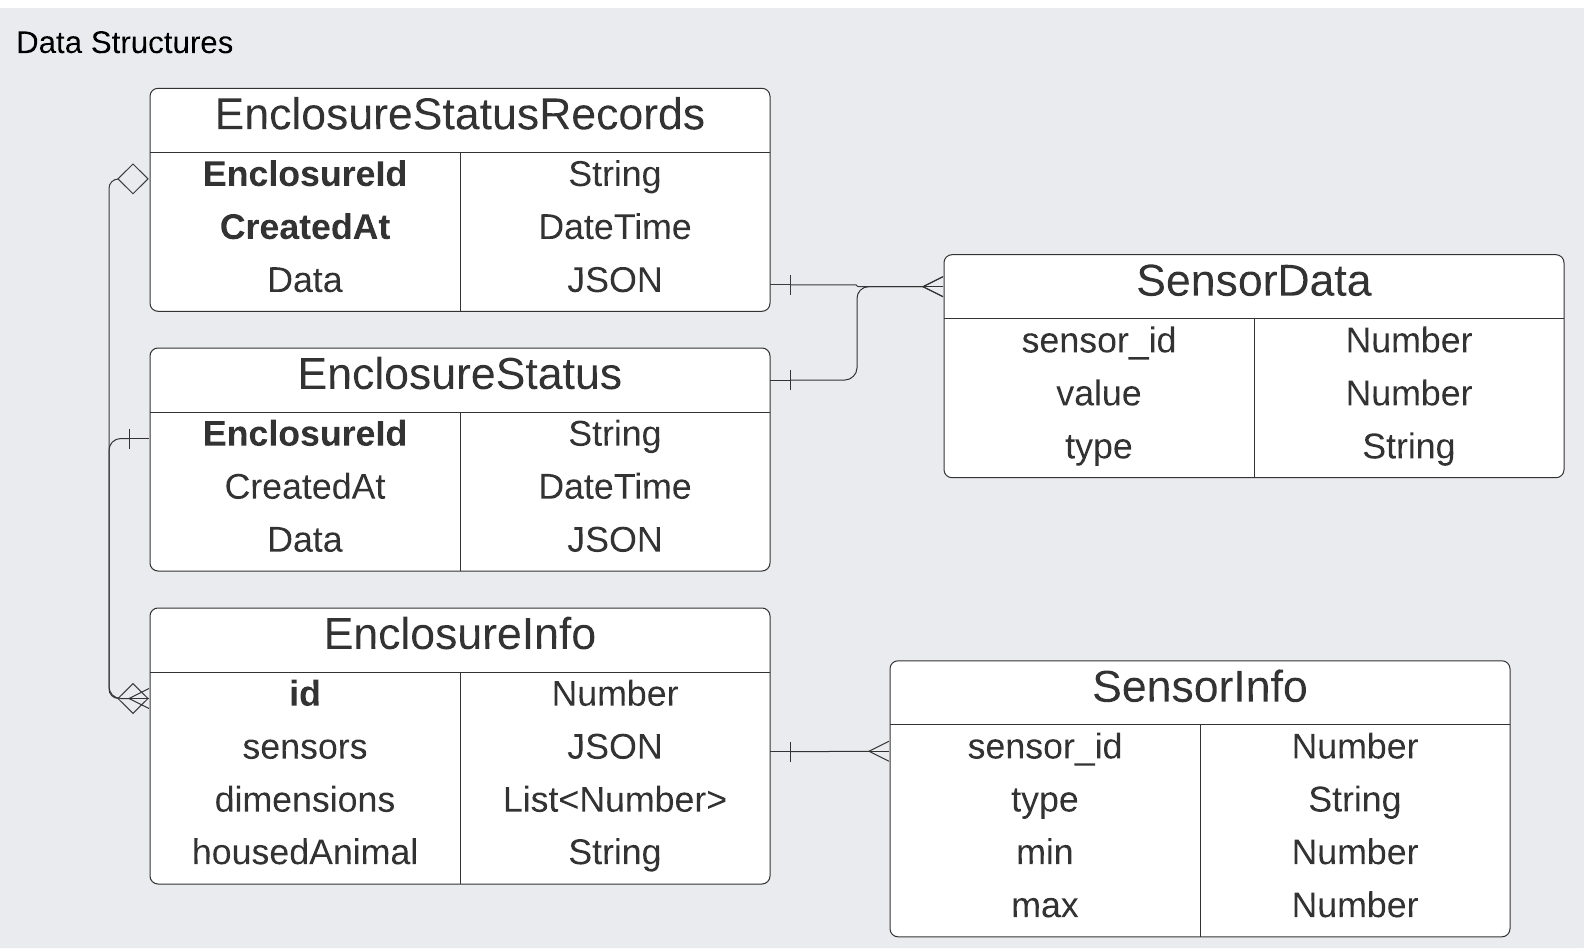
This portion of the project is the intermediary between the enclosure and the mobile application. Large swaths of time were devoted to learning about the multitudes of AWS services, and what purposes they each served. Each service came with its own nuances, and accompanying learning curves. Prior to implementation, entity relationship diagrams were devised to determine how information would later be stored within the database. In particular, models were created for a theoretical EnclosureInfo table - which would represent the information particular to a pet’s enclosure, and would include properties like: ranges of acceptable habitat conditions, enclosure dimensions, and the type of housed animal. Similarly, a schema was created for EnclosureStatusRecord - a table which represented the sensor readings reported by an enclosure. These tables were modeled using a NoSQL schema, with the idea being that properties of an animal’s enclosure would not necessarily be uniform, and that different enclosures could rely on a variety of different sensors. To model such a schema in a traditional relational database would be complex and require the creation of fields that would often be left null. Another decision was to create a table called “EnclosureStatus”, which is nearly identical to the EnclosureStatusRecord table. The difference between the two tables is that “EnclosureStatus” is partitioned by a unique enclosure id, and only stores the most recent sensor reading per enclosure, while EnclosureStatusRecord is partitioned by the pairing of an enclosure’s id and a timestamp. This decision was motivated by a desire to silo the data by their uses, and to improve the speed with which an enclosure’s most recent status could be queried. In addition to diagramming the database models, a tentative API specification was written in OpenAPI. Formalizing an API specification was a worthwhile exercise as it established how the mobile application and the backend would communicate, which in turn allowed for work on the two to be more easily parallelized.
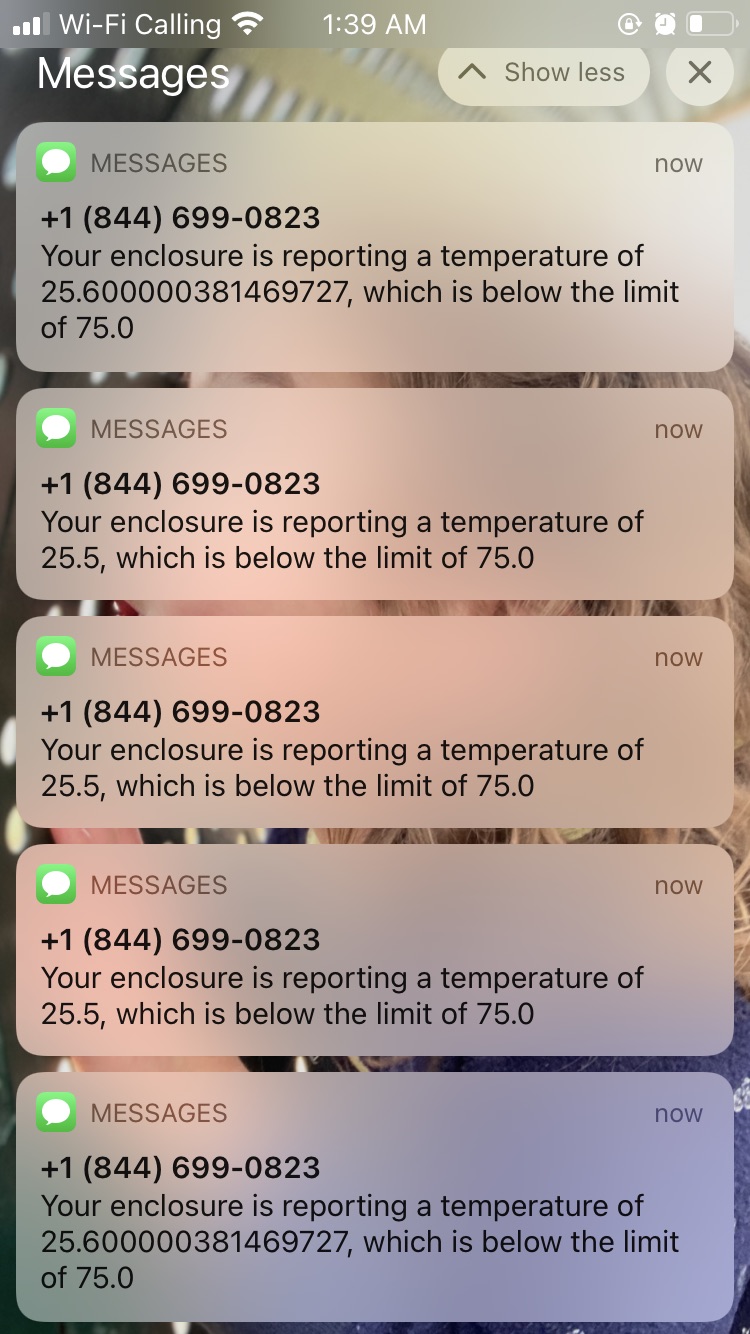
With the data models solidified, attention turned towards standing up a DynamoDB with tables that implemented them. Following the creation of the DynamoDB tables, a logical starting point for building out the rest of cloud infrastructure seemed to be setting up AWS IoT Core to communicate with the enclosure. This was done by defining an IoT Core Rule that subscribes to an MQTT topic and listens for updates from the enclosure. Once communication on the MQTT topic could be verified, the next goal was to persist this data to the DynamoDB. This was accomplished through an integration task between the two services - IoT Core and DynamoDB. In addition to persisting data to a database, another integration was created to run a one-off Lambda task, whose purpose is to compare new sensor readings against the parameters for the same enclosure. If the recently received sensor values are outside the ranges present in the associated EnclosureInfo entry, the Lambda function enques an event in Amazon’s Simple Notification Service (SNS), which sends an SMS message to the user, informing them of the observed deviation. Separate from the IoT Core service, an instance of AWS Kinesis Video Stream was deployed to receive and retain video footage streamed from the camera of the enclosure’s monitoring system. Due to potential cost, the retention policy for the stream was reduced to just several hours.
The last major component of the cloud infrastructure was the API Gateway - a service that routes HTTPS requests to appropriate AWS services. An instance of this service was set up to serve requests according to the aforementioned API specifications. This process of configuring API Gateway was especially tedious, as the UI was often unintuitive and the service required that security roles be finely tuned before any substantive progress could be made. In the case of the “/enclosure/{id}” and “/enclosure/{id}/status” endpoints, HTTP GET requests are routed to a Lambda Function, which queries their associated DynamoDB tables for their respective information: enclosure parameters and recent most sensor readings. Likewise, the “/enclosure/{id}/sensor/{sensorID}” endpoint is served by the same Lambda Function and returns a variable number of historical sensor readings from the EnclosureStatusRecords table. In this case, the returned database records are those whose timestamp occurred after a given DateTime parameter. In addition to fulfilling a GET request, the “/enclosure/{id}” path may also be the recipient of PUT requests, which are used to update information, specifically expected sensor ranges, related to the given enclosure. Finally, the “/enclosure/{id}/stream” endpoint routes any GET request to another Lambda function, which uses the AWS Kinesis Video API to create and return a new HLS streaming session. The returned session URL allows the mobile application to stream live camera footage of the enclosure in a secure fashion.
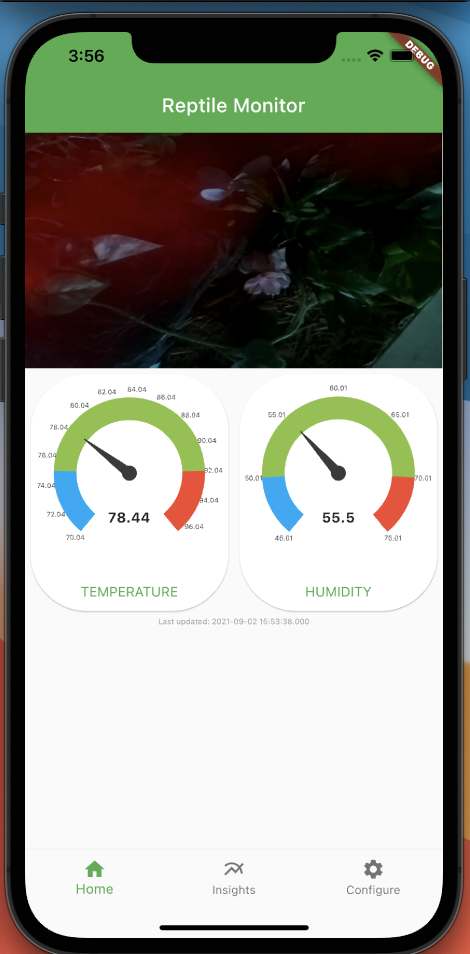
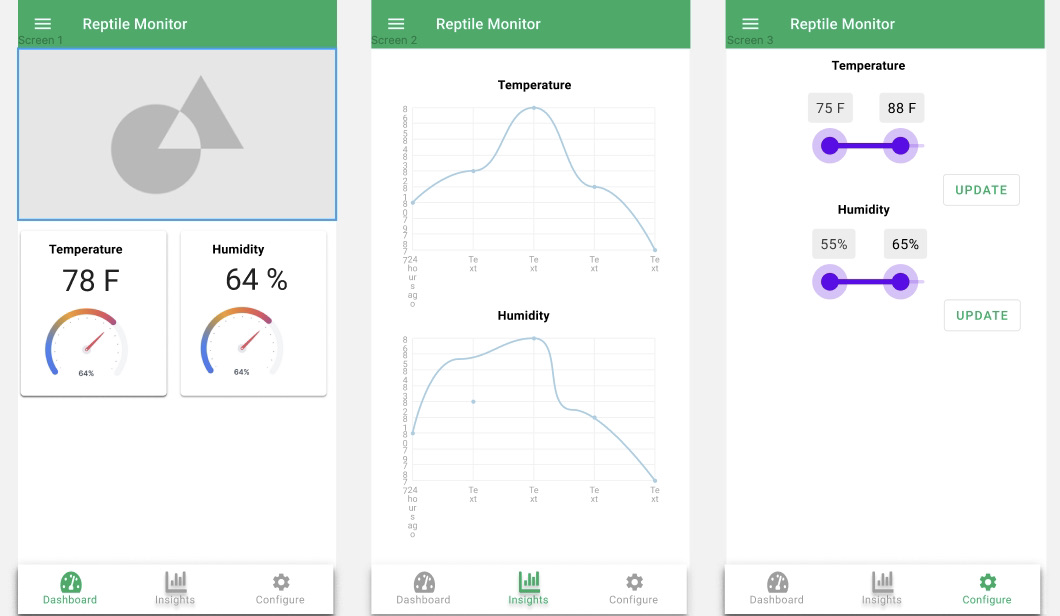
To begin work on this portion of the project, mock-ups were designed for the user interface. The final mock-up that was used to drive the development of the application was composed of three different screens. Each screen in the mock-up focused on fulfilling a goal of the project: simplifying monitoring, gathering novel insights, or promoting configurability. The first screen is meant to deliver on the promise of simplifying monitoring, and serves as a dashboard for the user - displaying the current conditions of the enclosure. At the top of this screen will be a live camera feed of the enclosure, and below it will be a variable number of gauges for each sensor housed inside the enclosure. The aim of the second screen is to produce charts and graphs that inform owners of recent trends in their enclosure’s conditions. The last screen will allow the user to configure the expected ranges of values for each sensor.
Though not explicitly stated as a goal of the project, one desire was to have the mobile application work on both iOS and Android devices. With this consideration in mind, Google’s Flutter framework appeared to be a reasonable option. After some environment set-up, movement began on implementing the UI elements of the application. In parallel, research was done to locate any resources having to do with performing HTTPS requests and approaching state management within Flutter. In doing so, it was learned that Amazon had recently released Flutter support for their Amplify package [5]. Amplify is a bundle of services and tools that assist in bridging mobile applications with AWS backends. By adding Amplify as a dependency to the project, only minor tuning needed to be performed to have the mobile application securely interface with the existing API Gateway. However, the packages did introduce some of its own headaches by not conforming to standard asynchronous practices in Flutter. As a consequence, any work that relied on the Amplify libraries had to be performed after a recurring task could verify the plugin had finished its initialization - a process that could take anywhere between 1 - 12 seconds. Once this oddity was accounted for, efforts could be made to retrieve data from the project’s cloud infrastructure. After proving that data could be retrieved from the API’s endpoints, language specific models were constructed to internally represent sensor readings and enclosure information. Then, code was written to map the JSON received by the API responses to instances of these models. Instances of these models are then bound to various UI elements, like charts and sensor widgets. While Flutter has an impressive number of UI components immediately available to developers, none seemed especially well suited for visualizing sensor values and their operating ranges. Rather than devoting time to learning the deeper intricacies of Flutter, third-party UI libraries were explored and compared. After sufficiently testing one of these libraries [6], it was included in the project’s manifest, and its “RadialGauge” element was used as the basis for displaying sensor readings and their associated ranges. In tandem with the work being done to send live video to the AWS Kinesis Video Stream, determining how to render the livestream within the app became the primary objective for the development of the mobile application. Fortunately, the Flutter team maintains a video player package that includes documentation for serving and playing network-based videos via HLS. As the app begins, and after the Amplify plugin has successfully been initialized, an HTTPS GET request is made to the stream endpoint for a given enclosure, where a streaming session URL is then generated by the cloud portion of the project and served back to the application. After this URL is successfully returned, the UI of the application is updated and the live footage from the enclosure begins playing.
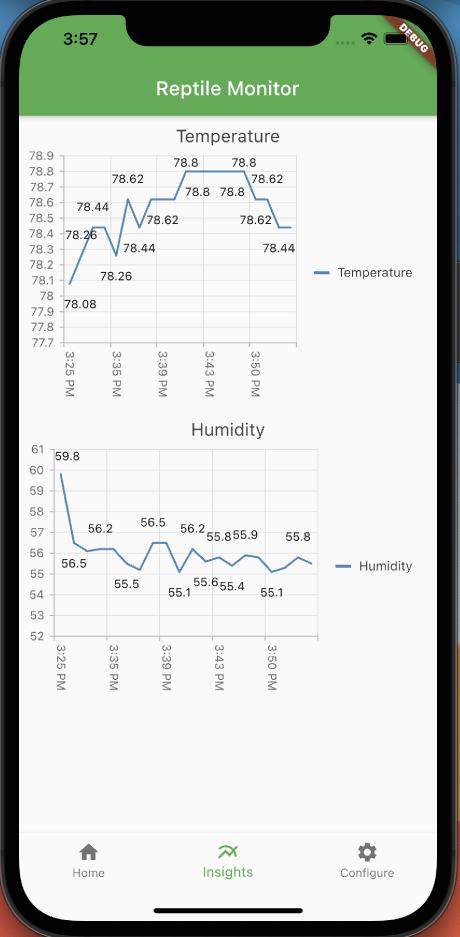
With the primary screen’s behavior implemented, sights were then set on adding the functionality for viewing the status of an enclosure over time. In attempting to do so, it became imperative that parts of the codebase would need to be refactored into smaller and more rigidly defined components. This process of refactoring allowed for screens to be modular and easily swappable, which enabled in-app navigation to be introduced almost trivially. The mock-ups for displaying the trends of an enclosure’s conditions relied extensively on graphs and charts. Recreating this design within the app required the addition of more third party UI libraries, but rather conveniently, the developers of the aforementioned library used for the sensor gauge widgets also maintain a charting and graphing library [7]. The supplied chart widgets were generally approachable and highly configurable. The more difficult problem was determining how sensor data should be queried by the app, and with what frequency. After tweaking, and gathering some user feedback, the decision was to have the default behavior be, that the app query the cloud database for all sensor readings from the last hour, and then requery on the same “/enclosure/{id}/data'' endpoint every minute. When requerying the endpoint, the startTime query parameter is updated to a more recent time, to avoid retrieving redundant information. Once these sensor readings are retrieved and mapped to model representations, they’re grouped by the minute they were recorded and are then subsequently grouped by their unique sensor id. After being properly grouped, averages are taken to produce a clear set of data points for the chart library. The resulting data points (60 at most), are then plotted to a line graph to depict the variance of an enclosure’s condition over the hour.
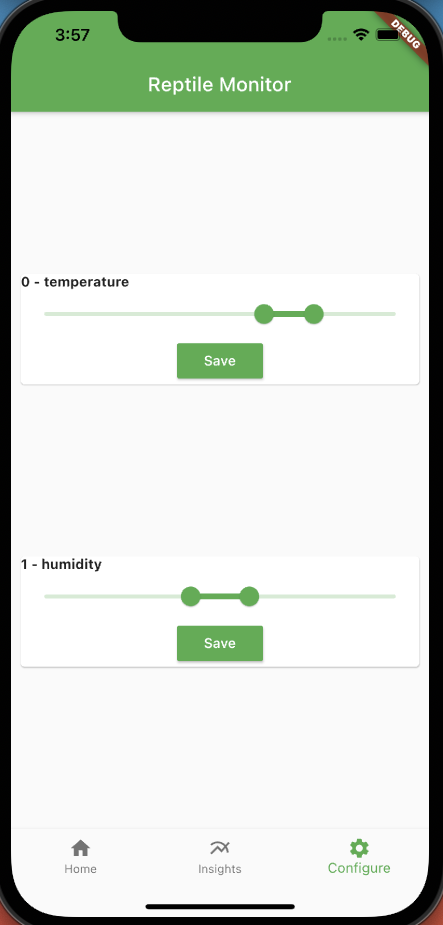
The last primary feature missing from the app was being able to modify the desired operating ranges for different sensors. Meaning, that a user should be able to uniquely specify what conditions are normal for a particular sensor, and therefore, a condition of the habitat. For example, in the case that a pet snake had developed stuck-shed, it might be appropriate for the owner to temporarily increase the ambient humidity of the enclosure. In order to accommodate this change, the owner could update the expected range of values for their enclosure’s humidity sensor. Otherwise, the user might be bombarded with notifications that their pet’s living conditions had become unsafe or unideal. To accomplish this, enclosure information, queried at the app’s startup, is referenced to configure a “RangeSlider” element for each sensor attached to the enclosure. The user may then adjust the minimum or maximum permissible values for the sensor by dragging the respective sliders of the UI component. Once satisfied, the user may choose to save the configuration. Upon doing so, a PUT request is made to the “enclosure/{id}” endpoint, as previously outlined in this document. Once this change has been persisted to the AWS backend, the sensor gauges on the dashboard screen are updated to reflect the changes. Likewise, the Lambda Function that handles notifying the user of sensor deviations would also make determinations based on the newly updated values.
[5] https://docs.amplify.aws/lib/restapi/getting-started/q/platform/flutter/
[6] https://pub.dev/packages/syncfusion_flutter_gauges
[7] https://pub.dev/packages/syncfusion_flutter_charts
Name | Group | What | Description |
Raspberry Pi | Enclosure | Device | The single board computer that resides in the enclosure and interfaces with sensors. The Pi is responsible for reporting data to the AWS backend. |
enclosure-status-get | AWS Cloud | AWS Lambda Function | This function is the intermediary between the API Gateway and the data stored in the different DyanmoDB tables. |
enclosure-status-notification | AWS Cloud | AWS Lambda Function | This function runs each time new sensor readings are written to the database. It queries the related EnclosureInfo to determine if the sensor readings are anomalous and should result in a notification being sent. |
enclosure-stream-get | AWS Cloud | AWS Lambda | This function retrieves an HLS streaming resource for an enclosure’s Kinesis Video Stream instance. |
update-enclosure-status-db | AWS Cloud | AWS Lambda | This function ensures that only the most recent sensor readings are written to the EnclosureStatus DynamoDB table. |
EnclosureStatusWarning | AWS Cloud | AWS SNS Topic | Messages received on this topic are routed to phone numbers via SMS. |
enclosure | AWS Cloud | AWS Kinesis Video Stream | The service that ingests video footage from the Raspberry Pi. |
StoreEnclosureStatus | AWS Cloud | AWS IoT Core Rule | This rule listens for messages sent over an MQTT topic, and runs various tasks upon receiving data, like: update-enclosure-status-db, enclosure-status-notification. |
APIGateway | AWS Cloud | AWS API Gateway | This service is responsible for routing API requests. |
EnclosureInfo | AWS Cloud | DynamoDB | The table that holds information particular to an enclosure. |
EnclosureStatus | AWS Cloud | DynamoDB | The table that holds only the most current sensor readings per enclosure. |
EnclosureStatusRecords | AWS Cloud | DynamoDB | The table that holds all reported sensor information for each enclosure. |
From a technical standpoint, the current iteration of this project accomplishes most of the functional goals that it set out to achieve. At the heart of the project was the goal of reducing the complexity of monitoring an animal’s enclosure. In its current form, the project satisfies this requirement by presenting sensor readings through the mobile application as color coordinated gauges. At a glance, these UI items make it clear whether the sensor value is within an acceptable range. In addition to the sensor readings, the mobile application retrieves live video footage of the habitat. This proof of concept also delivers on the promise of notifying a user when conditions in an enclosure deviate from the norm, by automatically sending the user SMS messages. However, it is worth noting that this project was unable to deliver these updates in the form of mobile push notifications, as previously hoped. This is attributable to restrictions imposed by Apple, which requires developers to have a paying subscription to implement push notifications in their iOS apps. In relation to the goal of user configurability, the mobile application also permits users to update the acceptable range for each measurement (e.g. temperature). While the mobile application is capable of returning sensor readings over time, and thus satisfying the last primary goal of the project, there’s certainly room to improve the ways in which users engage with these insights. Moving forward, the hope is to have the user be able to choose sensor readings between an arbitrary range of dates and times. With regard to this functional requirement, there were additional efforts made to gather more novel insights about a user’s pet. In particular, there were attempts made to capture and quantify the activity of the pet. The thought was to leverage the enclosure’s camera to detect motion within the enclosure. Upon detecting motion, a start time would be logged to a DynamoDB table and a related end time would be logged after some duration of inactivity had been exceeded. Two prototypes were constructed and evaluated for this task. One of these prototypes took the form of a Python script that leveraged the OpenCV library to detect motion, and ran locally on the Raspberry Pi. However, it appeared that running this script in parallel with the live streaming process would almost always result in some sort of race condition that would cause the script to crash. And when this script was able to run, it was prone to false positives. The second prototype was more sophisticated, and was implemented in the AWS backend of the project. This was done by referencing existing code samples from AWS that make use of the Rekognition service to perform video analysis. This sample was ported to a Lambda Function, and was used to test the service’s ability to do image classification on images extracted from the live stream footage. The hope was that salient terms - like “snake” or “reptile” might be identified by the Lambda task. However, testing yielded mixed results, and the extracted labels were largely dependent on the lighting within the enclosure. It was learned too late into this process that the Lambda Function would be a poor fit for working with real-time video, and that a proper solution would require the prototype be entirely re-written in a different language.
While AWS provides some security features out of the box, there are additional steps that could be taken to better ensure the safety of the system. For one, the API is publicly exposed and does not currently enforce any authentication when handling requests. Ideally, this would be remedied by having the user authenticate through the mobile application. After having been authenticated, a token could be returned and saved locally on the mobile device. Then, this unique token could be included in the header of each request that would be used to ensure the user had the right to access data related to only their own enclosure(s).
While the learning curve for AWS was often unforgiving, it seems unlikely that an alternative solution would have had the services, and the necessary integrations between them, to produce a comparable backend in a similar amount of time. Developing the same backend from scratch would have undoubtedly resulted in a sprawling and patchwork-like codebase. Choosing to broadly adopt AWS also paid dividends in unforeseen ways. AWS’s Cloud Metrics service was able to provide meaningful insights between services, and simplified the chore of debugging various services. Though discovered a little late into the development of the backend, the AWS Billing Service’s tools were also valuable in assessing which operations were most costly, and setting maximum budgets for each.
Unlike AWS, the decision to work with Flutter was less obvious, and its results were more checkered. While initial set-up with Flutter was tedious, the declarative paradigm of the framework made UI development quick and intuitive. Conversely, decoupling state from UI was often a challenge, as there’s no officially recommended approach to state management.While the framework is certainly growing in popularity, the entire Flutter ecosystem seems less mature. For one, the roadmap for the framework isn’t settled, and features are being routinely added while others are being deprecated. The scarcity of sample projects and third party libraries added to the difficulty, too. In all, electing to use Flutter wasn’t a poor decision, though it might have been worth exploring the merits of other solutions, like React Native, in greater depth.
In retrospect, this metric is likely where the project falls most short. Had time permitted, there was a backlogged task to design and 3D print a custom housing for the monitoring system. As it stands, the monitoring system is a jumble of cables and still requires the user to route wires through their animal’s enclosure. The enclosure’s monitoring system also remains difficult to set up from an I.T. standpoint, as it requires the unit to be accessed via SSH to start the monitoring processes - a task that the average individual would not be familiar with. And while some scripts were written to simplify the process of starting these monitoring processes, they still require the user to have some knowledge of Bash. In order to reduce the friction that goes into initially configuring the system, the Raspberry Pi would ideally host a small web server that the mobile application would reach out to upon the first use. Then, the user could configure the device from the mobile application. As the enclosure received these configuration details from the mobile app, it could use them to set up scheduled tasks that would launch monitoring processes as needed. Similar tasks would need to be introduced to automate the acquisition of unique credential files. While much of the cloud backend is structured to be scalable and capable of managing information for large numbers of monitoring systems, more work would need to be done to dynamically create Kinesis Video Streams for additional enclosures. With regards to the mobile application, reactions from users were generally positive. However, a common complaint was the lack of feedback for asynchronous operations. Often, UI elements appear to be in a deactivated state, and it’s not clear that the elements are attempting to perform work that’s network dependent. An obvious fix moving forward will be to have these elements show some progress indicator while they’re performing said asynchronous work. All together, there are a number of opportunities to improve the out of the box experience of the project.
Item | Quantity | Cost (per item) |
Raspberry Pi 3 Model B | 1 | $35 |
DHT22 Temperature/Humidity Sensor | 2 | $7.50 |
Arducam 5MP Camera for Raspberry Pi | 1 | $10 |
Monthly AWS Billing | 1 | $20.01 |
Total | NA | $63.98 |
As outlined above, the total cost of the equipment, and operating it intermittently over the course of a month, incurred a total cost of $63.98. Considering the cost of existing sensors and solutions, a one-time payment of $52.50 seems perfectly reasonable for such a specialized piece of equipment. However, a recurring cost to the user of ~$20 a month is admittedly less reasonable, especially if an owner possessed multiple pets and wished to install units for each. Delving into the AWS billing information, it was discovered that Amazon Kinesis was responsible for the lion share of the cost, with $16.51 being billed for the service. An instance of an Amazon Kinesis data stream had been set up at one point for a prototype to detect motion within the enclosure. The second most costly line item was Amazon’s Pinpoint service with a billed amount of $3.50. This service is responsible for provisioning phone numbers that are used to originate alert messages. In both cases, these costs were largely avoidable. In the instance of the Kinesis data stream, the resource was largely unused and did not ultimately make it into the final implementation. Nonetheless, it was still billed at an hourly rate while it was enabled. Similarly, in order to reserve phone numbers with Pinpoint, Amazon charges $1.75 a month per number. Through this billing breakdown, it was learned that a second phone number had inadvertently been configured on a different AWS region and was therefore left unused. Having adjusted for these oversights, it’s likely that the cost of operating the device would drop to just $1.75/month. While a single monitoring system did not exceed the free usage tier for Kinesis Video Streams, it seems likely that this would become more relevant if more enclosures were to rely on this instance of the AWS backend. Future methods of addressing such a concern might look like: increasing the time it takes for a streaming session to timeout, caching existing streaming sessions, or simply reducing the resolution of the footage streamed to AWS. A more involved option might be to have the enclosure only stream footage while a connection with the app is open.
To conclude, there are many opportunities to improve the experience of keeping reptiles. In particular, this project resolved to address the inadequacies of existing solutions for monitoring the conditions of reptile enclosures. This project demonstrates how hobbyist materials and access to existing technologies can be leveraged to produce an affordable proof-of-concept for a “smart” enclosure that’s supported by Amazon’s AWS services. Through the development of an accompanying mobile application, this project has attempted to convey the benefits that are afforded to pet owners when they’re able to remotely view the conditions of their pet’s habitat in a simple and approachable way. Secondarily, this project has showcased possible solutions for engaging reptile owners, by providing them with unique insights about their animal’s enclosure over time. This project also demonstrates how monitoring solutions could be improved to play a more proactive role in caring for an animal, by having the system be capable of sending SMS alerts to the owner.
Lima, Ed. “Monitoring IoT Devices in Real Time with AWS AppSync.” Amazon, 9 Dec. 2019, aws.amazon.com/blogs/mobile/iot-with-aws-appsync/.
Raspberry Pi (Trading) LTD. Raspberry Pi Compute Module 3 (CM3) datasheet Amazon, 4 Aug. 2021, datasheets.raspberrypi.org/cm/cm1-and-cm3-datasheet.pdf.
Sahin, Ned, et al. “Blogs.” Amazon, Build Automatic Analysis of Body Language to Gauge Attention and Engagement Using Amazon Kinesis Video Streams and Amazon AI Services, 12 Apr. 2018, aws.amazon.com/blogs/machine-learning/building-automatic-analysis-of-body-language-to-gauge-attention-and-engagement-using-amazon-kinesis-video-streams-and-amazon-ai-services.
Drasner, Sarah. “How to Create Api with Aws: Api Gateway Tutorial.” Netlify, 21 Aug. 2020,www.netlify.com/guides/creating-an-api-with-aws-lambda-dynamodb-and-api-gateway/api-gateway/.